Thursday, September 29, 2022

Activity 3.2.1 – Natural Resources Review


    Natural Resources surround us every day in whatever environment that we may be in. My concept map is breaks down the natural resources by touch, see and eat. When looking at the map each interconnected will impact a renewable resource or a nonrenewable resource.

     Natural resources are broken down into a renewable resource which means that is a source of which it could reproduce, and the nonrenewable resource means that once that it is gone there is no way to replace or remake. Some of the natural resources that are used today could actually be reused and recycled to avoid taking more away from the environment or taking away from the resources that are nonrenewable. 


Citations: https://nvcproxy.alamo.edu/login?url=https://video-alexanderstreet-com.nvcproxy.alamo.edu/p/oZvY48GoB

Thursday, September 22, 2022

Activity 3.1 - Human Population


Latin America & Caribbean Demographics

In order from More Developed to Least Developed.


  • Country Name: Puerto Rico
  • Birth Rate: 6 Births per 1000 Population.
  • Death Rate: 9 Deaths per 1000 Population.
  • Population growth rate (rate of natural increase): -0.3%.
  • Life expectancy for males and females: Males 77 and Females 84.
  • Fertility rate (average number of children per childbearing - aged female: Year 1990 was 7 and Year 2020 was 13 these demographics are taken from women aged 35+.
  • Gross National Income (GNI): 24,010


  • Country Name: Haiti
  • Birth Rate: 23 Births per 1000 Population.
  • Death Rate: 8 Deaths per 1000 Population.
  • Population growth rate (rate of natural increase): 1.5%.
  • Life expectancy for males and females: Males 62 and Females 67.
  • Fertility rate (average number of children per childbearing - aged female: Year 1990 was 2 and Year 2020 was 20 these demographics are taken from women aged 35+.
  • Gross National Income (GNI): 2,930

Unfortunately, Puerto Rico and Haiti's mortality rate is slightly similar per 1000 population. The leading cause of death in both Countries is caused by a stroke.  The birth rate in Haiti is 23 births per 1000 and in Puerto Rico the birth rate is 6 births per 1000. The population growth rate in Haiti is 1.5% as for Puerto Rico the growth rate is -0.3% the growth rate is declining due to the Nature Disasters that take place on the island. With this decreased in population in Puerto Rico impacts the birth rate to be lower compared to Haiti. The life expectancy in Haiti is males 62 years and 67 years in females, were as in Puerto Rico the life expectancy is males 77 years and 84 years in females. The life expectancy is short in Haiti due to the about 80% of the population is in poverty and none too little access to medical care. The fertility rate in 2020 for Haiti was 2.8 and in Puerto Rico 1.0 with both countries slowly declining attributing to using contraceptives and economic recessions. The average household income   in Haiti is 2,930 per capita, in Puerto Rico the household income in 24,010. These countries both suffer from having clean water, education, and poverty. The data is different in both countries but they both have very similar crisis. 

Based off the data that is provided by the PRB and the rest of the world is really not that far from where these two counties stand currently. The world is becoming overpopulated causing the birth rate to decline. The population growth is between the rest of the world and Haiti .5% higher. The life expectancy for the rest of the world is about the same for both countries. Health access, recessions and environmental crisis are impacting humanity.  

References: http://pavbca.com/walls/puerto-rican-flag-wallpapers, Leading Causes Of Death In Haiti - WorldAtlasIncome Inequality in Haiti - The Borgen Project

 10 Facts about Poverty in Puerto Rico - The Borgen Project, https://www.worldatlas.com/flags/haiti.


Thursday, September 15, 2022

Activity 2.2.1 - My daily water use


1. My water bill from the month of June - August. My use is 7730.36 gallons/month on average. 

2. The household use per month is 2576.6 gallons

3. The use per person per month is 85.5 per person.

4. Three bills from San Antonio Water system June - August. 
11969.6+8977.2+2244.3=23191.1/3 months = 7730.36 gallons /month on average. 

7730.36/3=2576.6 gallons/per person per month.

2576.6/30= 85.8 per day per person. 


 Name of water calculator                         URL                             My Per Person Usage                            

My San Antonio Water Bill                          N/A                              85.5 gallons/day per person

5. Homewaterworks   Water Calculator | Home Water Works (home-water-works.org)  106 gallons/day per person 

6.Water footprint calculator            Household (watercalculator.org)            15.38 gallons/day per person


The US average gallons used per person per day using the household calculator is 11 gallons and my use is 65 gallons per person in a household of 3. The water footprint calculator is 15 gallons per person household which is a lot lower than what my current use per day. The two online water calculators used to see the water use slightly use different data to capture the usage for either household or footprint. 

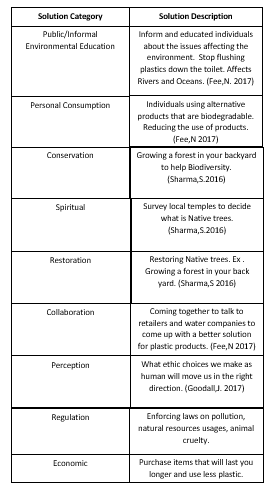
Activity 5.1 9 Things to do to Save the Planet

  References: Fee, N. (2017).  Why plastic pollution is personal   Links to an external site. [video]. TEDxBristol. https://www.youtube.com/...